SeaWorld Orca Data
A graphical look at SeaWorld orcas current and historic. Based on the data tables at www.OrcaHome.de.
A graphical look at SeaWorld orcas current and historic. Based on the data tables at www.OrcaHome.de.
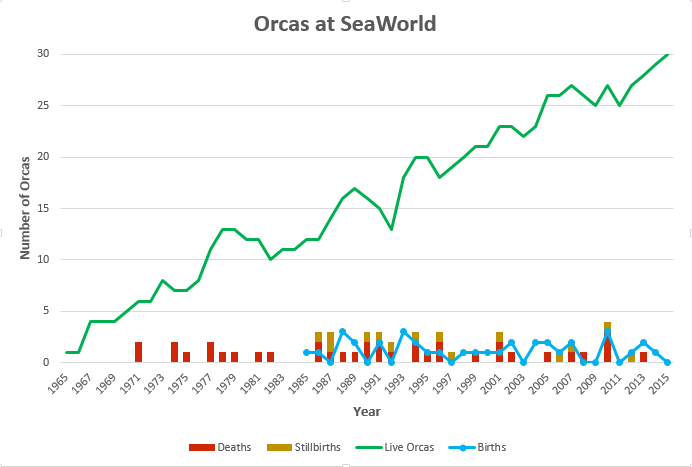
For each year since the beginning of SeaWorld, the number of live orcas, the number of births, and the number of deaths plus stillbirths / miscarriages.
This is for all orcas owned by SeaWorld, including those at Loro Parque.
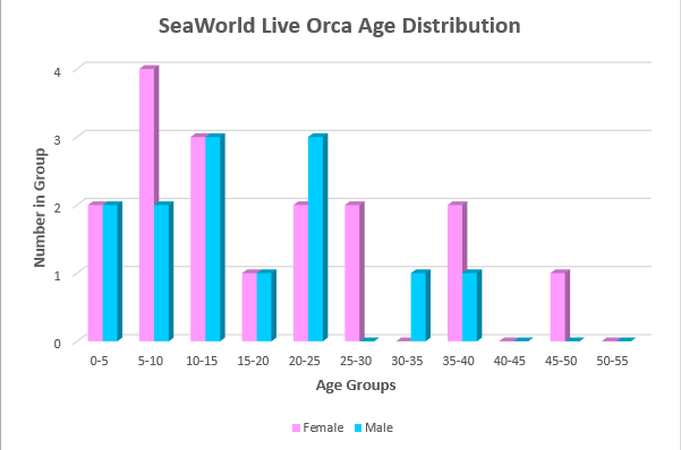
This is the age distribution of living SeaWorld orcas by gender
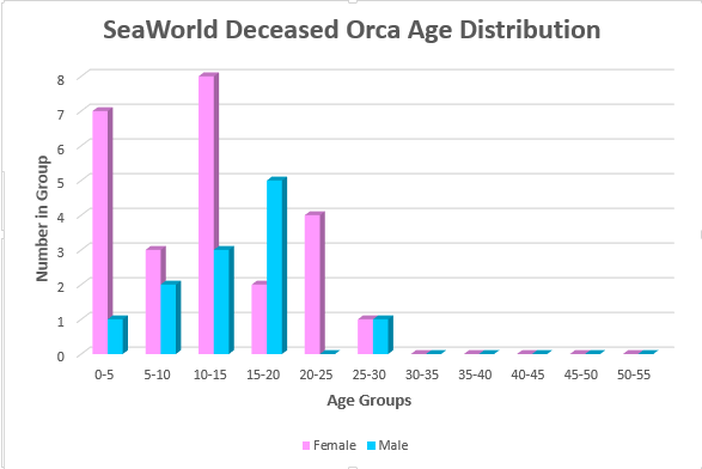
This is the age distribution for deceased SeaWorld orcas by gender
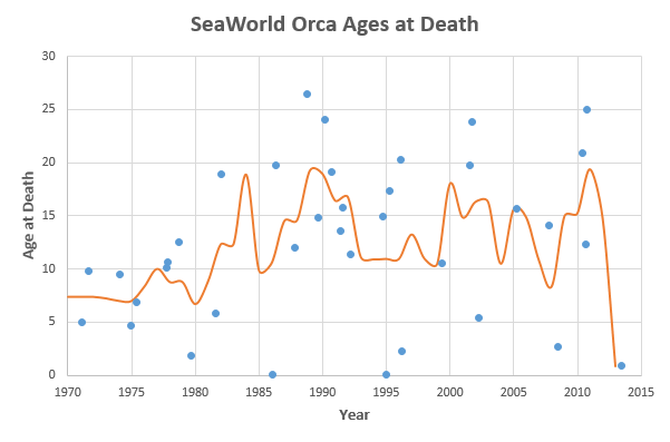
This is the age at death of SeaWorld orcas over the years. The orange line is a 5 year moving average of the same data. This is a technique for "smoothing" very erratic data to better visualize trends.
It appears that average age at death has gone from around 7 years at the beginning to around 13 years in more recent times.
It appears that average age at death has gone from around 7 years at the beginning to around 13 years in more recent times.
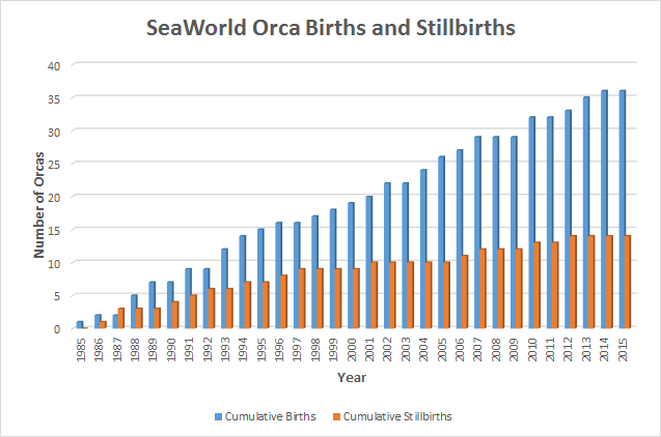
This chart shows cumulative live births and stillbirths / miscarriages.
The ratio of stillbirths to live births since the beginning of SeaWorld is 39%. The ratio since 2005 is 33%, so a slight improvement.
The ratio in the US for humans is 0.6%.
Stillbirths / miscarriages in the data provided include 2 cases of orcas who died while pregnant.
The ratio of stillbirths to live births since the beginning of SeaWorld is 39%. The ratio since 2005 is 33%, so a slight improvement.
The ratio in the US for humans is 0.6%.
Stillbirths / miscarriages in the data provided include 2 cases of orcas who died while pregnant.
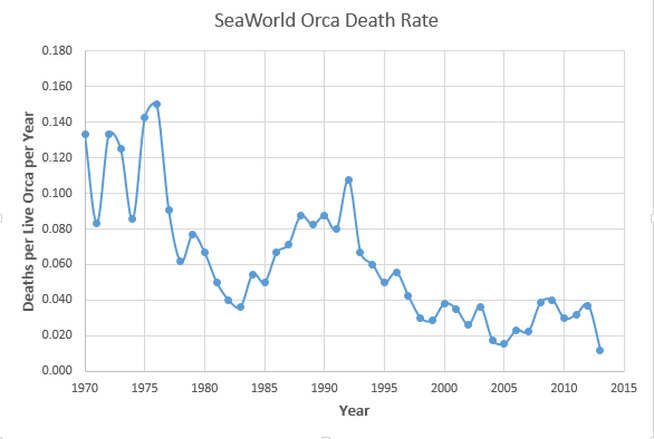
This is the death rate for SeaWorld orcas over time.
The death rate has decreased since the earliest years and appears to have leveled out in about the last 10 years.
The rate was calculated by dividing the [5 year moving average] deaths in a year by the number of live orcas in that same year.
The number of live orcas includes ones acquired from other marine parks. Deaths do not include the stillbirths.
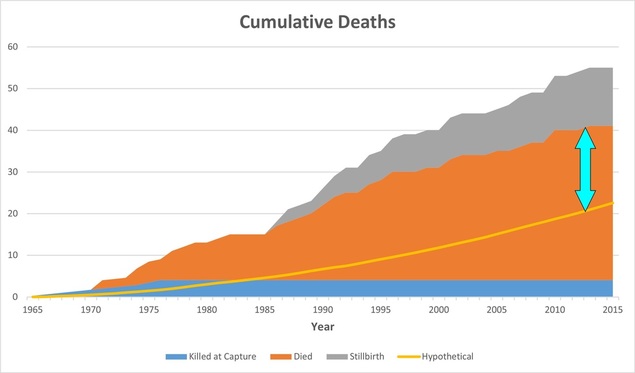
The brown area in this chart represents the cumulative deaths of SeaWorld's orcas. The gray area represents the cumulative stillbirths and miscarriages.
The dark blue area is an allocation of the orcas that died during capture operations. Thirteen orcas died during captures in the Pacific Northwest. SeaWorld got 14 out of the 45 orcas captured, so 4 capture deaths are allocated to SeaWorld.
Dark blue, brown, and gray are "stacked" area charts, i.e. these different categories add successively to produce the net height shown in the chart. Thus 37 orcas have died at SeaWorld since inception plus 14 stillbirths/miscarriages plus the 4 allocated capture deaths for a total of 55 orcas.
The yellow line represents the hypothetical deaths that would have resulted if SeaWorld's recent lower death rate had been in effect since 1965. The vertical distance between the top of the brown area and the yellow line is marked by a blue arrow. It represents the orcas that died while SeaWorld was learning orca husbandry. The offset between brown area and yellow line results from the high death rate that prevailed in the early years.
Thus the cost of achieving SeaWorld's current state of knowledge is about 20 orca deaths.